HOME GLOBALIZATION FILMS
| RESOURCES FOR THE INQUIRING MIND
HOME GLOBALIZATION FILMS |
|
HOME About Contact TOOLS Research Tools GLOBALIZATION Globalization Home Resources/Links Economics Books Courses G101 Description Start G102 Description Start Sample Modules from G101 & G102 Definitions Unequal Expansion Comparative Advantage GDP: Calculation IMF Disappearing Borders Global Consciousness MINI COURSES About Mini Courses Outsourcing 101 The Complicity Problem Taxes 101 Income Tax Brackets Effective Tax Rates Game: Your REAL taxes Global Warming 101 Gore vs. Skeptics Business Ethics 101 Basic Business Ethics Critical Thinking 101 Intro to Critical Thinking FILMS Films Home Film Books The Magic Mountain Film Theory Links Film Info Links Aristotle's Six Elements Visual Narrative: Ran Recommended Films Seven Mistakes of Film Criticism What Works and What Doesn't Miscellaneous Reviews Random Comments Lesser-Known Films Films and Communism Comics Help support this site by placing book or merchandise orders through us to Amazon. |
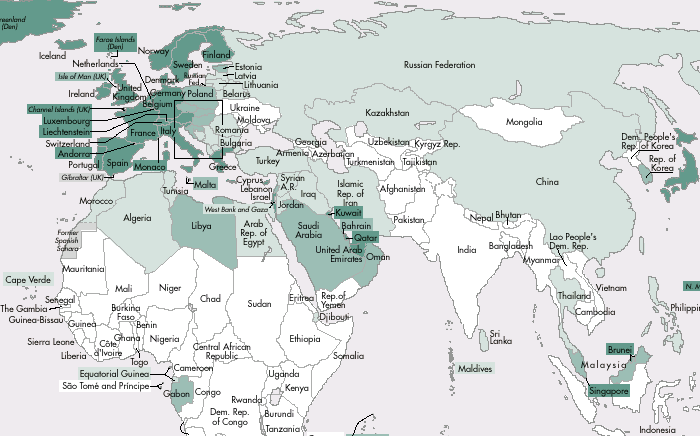
Unequal Economic DevelopmentAlthough most economies have expanded significantly in the last 40 years,this expansion has been far from equally distributed around the world. Critics of globalization point out that while income in developed regions of the world (such as the United States, Western Europe, and Japan) have increased significantly during the last 30-40 years, other regions (such as Sub-Saharan Africa) have barely improved at all. The result is: A widening gap between the rich nations of the world and the poor nations. According to the World Bank, "In 1960 per capita GDP in the richest 20 countries was 18 times that in the poorest 20 countries. By 1995 this gap had widened to 37 times..." The difference in the rate of growth is depicted in the chart below. (Original Source URL: http://www.worldbank.org/poverty/wdrpoverty/report/ch3.pdf)  Graphic Source: World Bank, 1999 World Poverty Report The huge inequalities that exist today are shown in the map below, depicting the existing (1999) distribution of world incomes. The regions in white have an average GNP per capita (an approximation of income) of $755 or less. This represents an average income of about $2.00 per day -- the income the World Bank uses to define the "poverty line" in world incomes. The areas in dark green have average incomes at least 12 times higher ($9266 per year or more). Be aware that the map shows the AVERAGE GNP per capita. Some of the countries in the areas in white have a substantial number of well-to-do people. India for example, has a large, and rapidly growing, middle-class. But it also has millions of people who are in extreme poverty, causing its average to be very low. The World Bank defines extreme poverty as "one dollar per day or less." As of 2001, approximately 21% of the world's population was living on $1 per day or less. For many economists, politicians, and moral leaders around the world, putting an end to this extreme poverty, and to extreme differences in income, is the single most important goal of the next century. Remember, the scope and magnitude of the present economic inequalities in the world is, in the opinion of many commentators on the topic, the single most important factor to be aware of in the study of Globalization. You should be familiar with the facts presented on this page. 
 Map Source: World Bank, 1999 World Poverty Report Created on ... February 07, 2004. Revised 10:46 3/15/2005 |